
Market research is a growing multi-billion-dollar industry.
Brands leverage market research insights to introduce customer-focused offerings and improve their experiences.
From mobile-first surveys to social media analytics, researchers have access to a growing toolkit helping companies make data-driven business decisions.
Here’s a breakdown of what you’ll find on this page:
Market Research Industry Statistics
Market Research Methods Statistics
AI in Market Research Statistics
Market Research Statistics (Highlights)
The global market research industry is forecasted to bring in $140 billion in revenue in 2024.
Online/mobile quantitative research services accounted for 35% of worldwide revenues of market research companies.
Around 47% of researchers worldwide state that they use AI regularly in their market research activities.
Online surveys rank as the most used quantitative method among market research professionals with 85% of respondents who say they use this method regularly.
Online in-depth interviews with webcams rank as the most used qualitative research method, with over one-third (34%) of researchers using it regularly.
1. Market Research Industry Statistics
This section presents key statistics to show market research industry revenues, leading players in the industry and revenue breakdown by market research services.
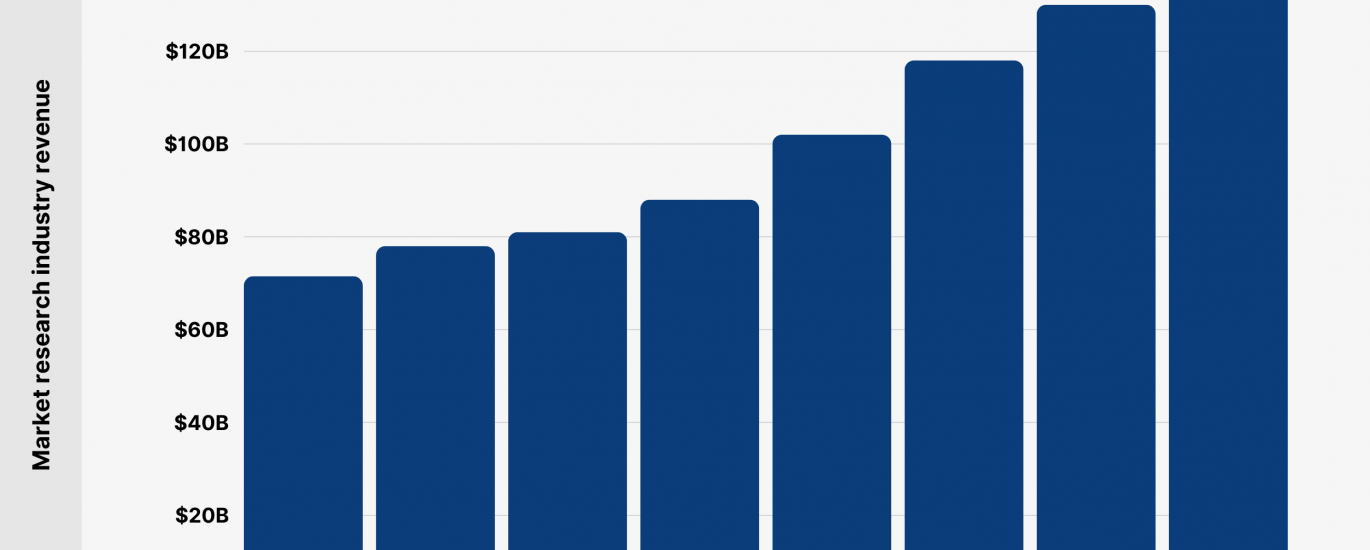
Global market research industry forecasted to generate $140 billion in revenue in 2024 (up from $130 billion in 2023) – ESOMAR
Note: Includes data from multiple sources (ESOMAR 1, ESOMAR 2, ESOMAR 3, Consultancy.org)
Year
Market research industry revenue (worldwide)
2016
$71.5 billion
2017
$78 billion
2018
$81 billion
2019
$88 billion
2021
$102 billion
2022
$118 billion
2023
$130 billion
2024
$140 billion
Between 2021 and 2024, the market research industry grew by 37.25% from $102 billion to $140 billion – ESOMAR
When ranked by market research turnover, the US market leads the ranking with $48 billion, followed by the UK ($9.1 billion) and China ($2.88 billion) – ESOMAR
Note: Data as of 2021
Country
Market Research Turnover
United States
$48 billion
United Kingdom
$9.1 billion
China
$2.88 billion
India
$2.2 billion
France
$2.12 billion
Germany
$2.11 billion
Japan
$2.04 billion
Australia
$753 million
Canada
$606 million
Italy
$586 million
Spain
$555 million
South Korea
$507 million
Gartner holds the top position as the highest-earning company in the market research field with $5.48 billion in research revenue in 2022, followed by IQVIA ($5.43 billion) and Salesforce ($4.52 billion) – Statista
Company
Research Revenue (2022)
Gartner
$5.48 billion
IQVIA
$5.43 billion
Salesforce
$4.52 billion
Adobe Systems
$4.42 billion
Nielsen
$3.55 billion
Kantar
$2.72 billion
Ipsos
$2.53 billion
Circana (IRI+NPD)
$2.21 billion
CoStar Group
$2.18 billion
S&P Global (IHS Markit)
$1.97 billion
Online/mobile quantitative research services contributed 35% to the worldwide revenue of market research companies in 2022. Other major revenue contributors include reporting (20.2%), online traffic/web analytics (9.7%), online/mobile qualitative research (6%) – Statista
Type of Market Research Service
Revenue Share
Online/mobile quantitative research
35%
Reporting
20.2%
Online traffic/web analytics
9.7%
Online/mobile qualitative research
6%
Telephone CAITI
3.6%
Online research communities
2.8%
Social media monitoring
2.7%
Automated digital/electronic
2.7%
Face-to-face group discussions/focus groups
2.6%
Face-to-face
2%
In-depth face-to-face interviews
2%
Other qualitative
1.7%
Other quantitative
1.7%
Audience measurement
0.9%
Traditional ethnography
0.8%
Other
0.4%
2. Market Research Methods Statistics
There’s a growing number of market research methods from traditional surveys to eye tracking available to market research professionals. In this section, we’ll cover recent stats on most used market research methods.
According to a survey, 87% of market researchers worldwide state that at least half of their qualitative research is carried out remotely or online – Qualtrics
Region
Qualitative Research Conducted Online (50% or more)
Asia-Pacific and Japan
84%
Europe, Middle East and Africa
85%
Latin America
90%
North America
87%
Online surveys rank as the most used quantitative method among market research professionals with 85% of respondents who claim they use this method regularly, followed by mobile surveys (47%) and proprietary panels (32%) – Statista
Quantitative Method
Share of Researchers Who Use Regularly
Online surveys
85%
Mobile surveys
47%
Proprietary panels
32%
Online communities
26%
CATI
13%
Face-to-face
12%
CAPI
10%
Automated measures/people meters
7%
Mail
4%
IVR
4%
Neuroscience measurements
4%
Biometrics
3%
Other quantitative techniques
16%
Among qualitative methods, online in-depth interviews with webcams (34%) and online focus groups with webcams (28%) are most commonly used among researchers – Statista
Qualitative Method
Share of Researchers Who Use Regularly
Online IDis with webcams
34%
Online focus groups with webcams
28%
Online communities
28%
Mobile
20%
In person IDIs
16%
In person focus groups
14%
Telephone IDIs
13%
Bulletin board studies
11%
In-store/shopping observations
11%
Chat (text-based) online focus groups
10%
Other qualitative methods
10%
Chat (text-based) online IDIs
7%
Monitoring blogs
7%
Automated interviewing via AI systems
5%
Telephone focus groups
3%
By survey type, nearly half of market research spending (43.8%) was used on customer satisfaction (16.4%), market measurement (15%), user experience surveys (12.4%) – Statista
Survey Method
Share of Spending
CRM Systems/Customer Satisfaction
16.4%
Market measurement
15%
User experience
12.4%
Usage and behavioral studies
11%
(Media) Audience research
10.3%
New product/service development
9.3%
Opinion survey/polling
5%
Omnibus/cost-sharing surveys
5%
Advertising/brand tracking
4.6%
Employee satisfaction
2.5%
Ad pre-test
1.9%
Business-to-business research
1.8%
Market modeling
1.4%
Non-profit research
0.9%
Mystery Shopping
0.5%
Other
1.9%
Nearly 6-in-10 (57.2%) survey responses worldwide were submitted from mobile devices in Q3 2023. That’s a slight increase from 56.2% in Q3 2021 – SurveyMonkey
Date
Mobile
Non-Mobile
Q4 2020
52.0%
44.7%
Q1 2021
52.1%
44.7%
Q2 2021
53.0%
43.8%
Q3 2021
56.2%
41.1%
Q4 2021
55.3%
41.6%
Q1 2022
55.0%
41.5%
Q2 2022
56.1%
40.6%
Q3 2022
58.2%
38.7%
Q4 2022
56.9%
39.9%
Q1 2023
54.7%
40.4%
Q2 2023
55.1%
40.3%
Q3 2023
57.2%
38.6%
In the US mobile survey responses accounted for 47.6% of all survey responses (vs. 48.2% on non-mobile devices) in Q3 2023 – SurveyMonkey
Date
Mobile
Non-Mobile
Q4 2020
39.7%
55.7%
Q1 2021
40.7%
54.9%
Q2 2021
39.7%
56.0%
Q3 2021
41.8%
54.5%
Q4 2021
41.8%
53.5%
Q1 2022
42.0%
52.9%
Q2 2022
43.4%
51.8%
Q3 2022
44.7%
51.3%
Q4 2022
43.9%
51.4%
Q1 2023
43.7%
50.2%
Q2 2023
45.1%
49.7%
Q3 2023
47.6%
48.2%
On average, online surveys hosted on one of the platforms included 11 questions in 2023. That’s down from 11.8 questions in 2019 – SurveyMonkey
Year
Average Number of Questions
2010
12.1
2011
12.0
2012
11.8
2013
11.5
2014
11.5
2015
13.0
2016
13.1
2017
13.2
2018
12.2
2019
11.8
2020
10.2
2021
10.5
2022
10.7
2023
11.0
More than half (54%) of online surveys feature 5 or fewer questions per page – SurveyMonkey
Number of Questions Per Survey Page
Share of Surveys
1 or fewer
7%
>1 to 2
14%
>2 to 3
13%
>3 to 4
11%
>4 to 5
9%
>5 to 6
7%
>6 to 7
6%
>7 to 8
5%
>8 to 9
4%
>9 to 10
5%
More than 10
18%
More than 6-in-10 (62%) researchers say that their “company depends on their research and insights significantly” – Qualtrics
A majority of researchers have reported an increase in their budgets allocated for customer experience (CX) research (53%), consumer trends (52%), UX research (51%), qualitative research (51%) and brand strategy (50%) – Qualtrics
3. AI in Market Research Statistics
AI is disrupting nearly every industry and job function. Market research is no exception and there are various AI use cases to apply in the everyday work of market researchers. We’ll explore the latest stats on AI adoption rate among market researchers in this section.
Around 47% of researchers worldwide claim that they use AI regularly in their market research activities – Qualtrics
The share of AI adopters among researchers varies depending on the region, with the highest usage in Asia-Pacific & Japan (58%) and the lowest in North America (39%) – Qualtrics
Region
Share of Researchers Who Regularly Use AI
Asia-Pacific and Japan
58%
Europe, Middle East and Africa
51%
Latin America
51%
North America
39%
The vast majority (73%) of researchers worldwide claim they’re “very confident” or “extremely confident” on how to apply AI to their market research activities – Qualtrics
Around 1-in-4 researchers state they’re concerned about AI impact outpacing their personal or team skills – Qualtrics
Conclusion
That’s it for my list of market research statistics.
While market research has been around for a while, it has been undergoing constant transformation. It will be interesting to see how AI impacts market research projects.
We update this list of statistics from time to time so feel free to check it later for new insights.
The post 19 Key Market Research Statistics appeared first on Backlinko.