

Most LinkedIn benchmarks give you the wrong number to aim at. These LinkedIn benchmarks by industry account for both sector and company size, giving B2B marketers a more accurate comparison point. They average engagement rates across an entire industry without accounting for company size, which means a 200-person technology company gets measured against a figure influenced by enterprise players and 10-person startups in equal measure. Neither is your peer group.
This report works differently. We segment our platform data by both sector and company size, which gives you a figure that reflects what companies genuinely comparable to yours are achieving. The April 2026 dataset covers seven B2B sectors, drawn from LinkedIn company pages managed through Oktopost. For Technology, Financial Services, Business Services, Legal Services, and Manufacturing, the cohorts are large enough to be statistically reliable. For Healthcare and Transportation, the data is directional. We are publishing it transparently because a directional signal from first-party platform data is more useful than a confident figure from someone else’s methodology.
These LinkedIn benchmarks by industry are segmented by both sector and company size, giving B2B marketers a more accurate performance benchmark than industry-wide averages.
Benchmark your own LinkedIn page
The numbers in this report show what top-performing organizations achieve. But the real question is where your company sits today.
Oktopost’s free LinkedIn Benchmarking Tool compares your page against organizations in your industry and company-size cohort, helping you understand whether you’re performing at the median, upper quartile, or top-decile level.
Get your benchmark score in under 60 seconds and see how your performance compares against peers that actually look like your business.
How LinkedIn engagement rate by industry is calculated
P50 is the median. P75 means you are outperforming three-quarters of your sector-and-size peers. P90 is the top 10% threshold: the bar you would need to clear to be in the top decile for your sector and size. Benchmarks cover four metrics: engagement rate, engagements per post, impressions per post, and follower growth rate, all segmented by the company size band LinkedIn assigns to your page.
The critical rule: always compare within your size band. A 200-person healthcare company and a 200-person technology company are not the same LinkedIn audience, and this report treats them accordingly.
Sectors covered: April 2026
Business Services, Financial Services, Healthcare, Legal Services, Manufacturing, Technology, Transportation.
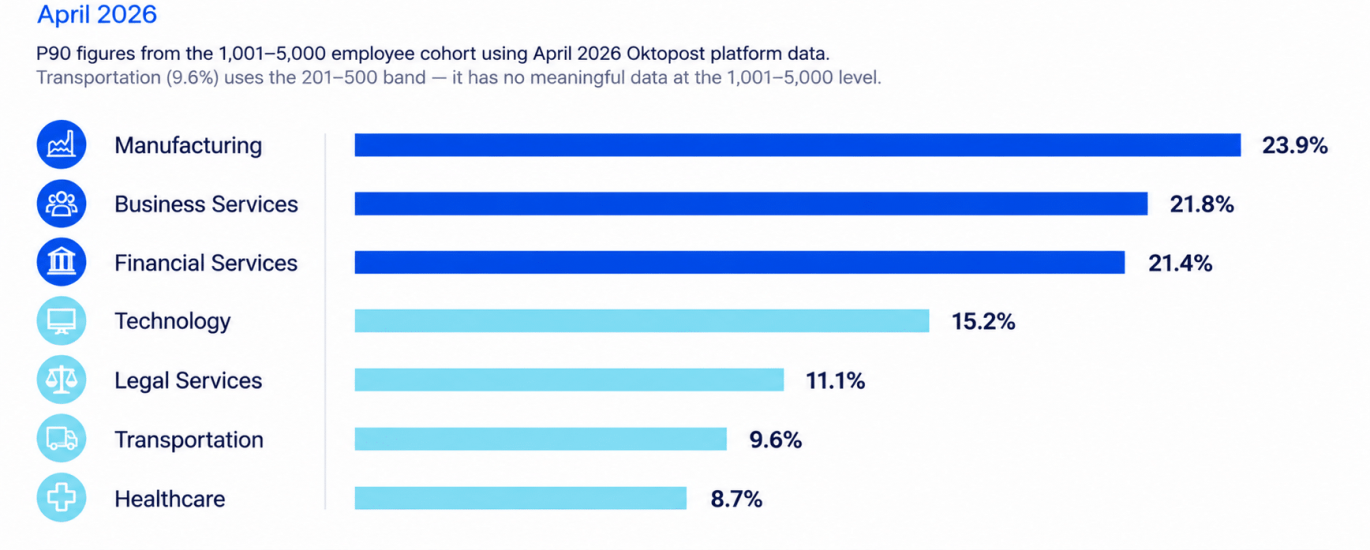
P90 engagement rate by industry, April 2026. Source: Oktopost platform data.
LinkedIn benchmarks by Industry: Key findings from April 2026
If you’re short on time, these are the five findings that matter most:
Manufacturing leads large-company engagement, with a P90 engagement rate of 23.9% among organizations with 1,001-5,000 employees.
Business Services is the only sector where engagement increases consistently as company size grows.
Technology engagement compresses sharply with scale, falling from 37.9% in the 11-50 employee band to 15.2% in the 1,001-5,000 band.
Financial Services remains one of the strongest-performing sectors, reaching a P90 engagement rate of 21.4% among large organizations.
Company size matters almost as much as industry. Comparing your LinkedIn page against generic industry averages can lead to misleading conclusions about performance.
The biggest takeaway: benchmark against organizations that match both your industry and your size. Anything else risks setting the wrong target.
These LinkedIn benchmarks by industry show why company size is just as important as sector when evaluating performance.
Technology
The most common mistake B2B technology companies make on LinkedIn is benchmarking against the wrong peer group. A 50-person SaaS startup looks at an industry average, has no idea what company sizes went into it, and ends up chasing a number that does not apply to them. The April 2026 data makes the problem concrete: P90 engagement rate for the 11-50 employee band is 37.9%. For the 1,001-5,000 band it is 15.2%. Same sector. Same metric. Different game entirely.
The pattern holds because smaller pages attract followers who opted in deliberately, often because of a personal connection to the company or its founders. That selectivity drives up the rate. Larger pages reach more people per post, but that reach is diluted by followers with weaker intent. Both cohorts can be top-decile performers. The benchmarks just look very different and should never be compared directly.
The LinkedIn benchmarks by industry reveal that technology companies experience one of the widest performance gaps between small and large organizations.
Volume tells the other side of the story. Technology companies in the 201-500 band hit 453 engagements per post at P90. At the 5,001-10,000 band, the top 10% reached 12,937 impressions per post. The rate compresses with size. The absolute reach expands. Understanding which metric matters for your goals is the starting point for any honest LinkedIn strategy in this sector.
Benchmark table: Technology
MetricCompany sizeP90Engagement rate11-5037.9%Engagement rate51-20021.6%Engagement rate201-50023.0%Engagement rate1,001-5,00015.2%Engagements per post201-500453Impressions per post5,001-10,00012,937Follower growth rate1,001-5,0007.7%
P90 = top 10% threshold. The 51-200, 201-500, and 1,001-5,000 bands each have 30 or more companies and are the most statistically reliable reference points. The 11-50 and 5,001-10,000 figures are directional.
Technology: P90 engagement rate by company size, April 2026. Source: Oktopost platform data.
Oktopost’s take: The 1,001-5,000 band is the most misread in this sector. A technology company in that cohort running at 8-10% engagement is not underperforming. They are in the second quartile, a very different diagnosis from “our engagement is low.” At P90, those companies hit 15.2% engagement rate and 7.7% monthly follower growth. That is what excellent looks like at that size. It is not 37%.
How does your company compare?
One of the biggest mistakes B2B marketers make is comparing themselves against generic industry averages.
If you’re responsible for LinkedIn performance, benchmark your page against companies in your exact industry and employee-size band. The difference between average and top-decile performance is often far smaller, or larger, than most teams assume.
Use Oktopost’s free LinkedIn Benchmarking Tool to see where your page ranks.
Business Services
Business Services breaks the pattern that holds across every other sector in this dataset. Usually, engagement rate compresses with company size: smaller pages punch above their reach while larger pages trade rate for volume. In Business Services, it runs the other way.
At the 10,000-plus employee band, P90 engagement rate is 25.5%. That is higher than the equivalent rate in any smaller Business Services band. It is also higher than mid-market Technology. Business Services is the only sector in our April 2026 data where scale is a content advantage, not a headwind.
Our read on why: large Business Services firms have access to proprietary research and sector intelligence that smaller players simply cannot produce at the same quality or frequency. When a major research or consulting firm publishes original data, they are distributing something genuinely scarce. That content earns disproportionate engagement because there is no substitute for it. Scale enables this content model. Smaller firms compete on a different axis entirely, which the data also reflects.
The volume figures at 10,000-plus are the highest in the entire April 2026 dataset: 2,515 engagements per post and 24,506 impressions per post at P90.
Benchmark table: Business Services
MetricCompany sizeP90Engagement rate51-20010.7%Engagement rate201-50019.9%Engagement rate1,001-5,00021.8%Engagement rate10,000+25.5%Engagements per post10,000+2,515Impressions per post10,000+24,506Follower growth rate1,001-5,0005.7%
P90 = top 10% threshold. The 51-200, 201-500, and 1,001-5,000 bands each have 30 or more companies. The 10,000-plus band is directional (n=15).
Business Services: P90 engagement rate, 10,000+ employees, April 2026. Source: Oktopost platform data.
Oktopost’s take: If you run LinkedIn for a large professional services firm and your engagement rate is below 20%, the benchmark says the ceiling is visible and the gap is closeable. The content model that gets you there: proprietary data, named expert authorship, research-led publishing on topics your audience cannot get elsewhere, is replicable. It requires editorial investment, not more posts.
Manufacturing
Manufacturing does not get the credit it deserves as a B2B LinkedIn channel. The April 2026 data suggests it should.
P90 engagement rates across Manufacturing size bands are consistently strong: 19.3% at 51-200 employees, 24.5% at 201-500, and 23.9% at 1,001-5,000. Those figures are comparable to Business Services and above Technology at equivalent cohorts. This is not a sector struggling with LinkedIn engagement. It is a sector that does not talk about its LinkedIn results loudly enough.
Among all LinkedIn benchmarks by industry, Manufacturing delivered some of the strongest engagement rates in April 2026.
The reason is the audience. B2B buyers in manufacturing, from plant managers and operations directors to procurement leaders and engineers, follow company pages because they are interested in what those companies know, not just what they sell. Technical content from a credible industrial source earns attention from an audience that is selective about who they follow. That selectivity drives the engagement rate. The 1,001-5,000 band is the most robust reference point in this sector (n=27), and it shows 434 engagements per post and 4,004 impressions per post at P90 alongside a 5.5% monthly follower growth rate.
Benchmark table: Manufacturing
MetricCompany sizeP90Engagement rate11-5037.4%Engagement rate51-20019.3%Engagement rate201-50024.5%Engagement rate1,001-5,00023.9%Engagements per post1,001-5,000434Impressions per post1,001-5,0004,004Follower growth rate1,001-5,0005.5%
P90 = top 10% threshold. Most Manufacturing cohorts are directional (n=15-27). The 1,001-5,000 band (n=27) is the strongest anchor. The 11-50 figure is from a very small sample (n=2).
Oktopost’s take: Manufacturing marketers are underselling their LinkedIn results. If you are in that sector and hitting 20%+ engagement at the mid-market level, you are benchmarking above Technology at the same size band. Most B2B LinkedIn conversations treat technology sector performance as the reference point. The April 2026 data says Manufacturing is a legitimate counterargument worth making.
Financial Services
What stands out is the follower growth signal.
The 201-500 employee band hit 18.2% monthly follower growth rate at P90. That is one of the highest growth figures in the entire April 2026 dataset across all sectors. Mid-market Financial Services companies are not just active on LinkedIn. They are growing their audiences substantially faster than comparable companies in almost every other sector we track.
The Financial Services LinkedIn benchmarks by industry highlight the importance of audience growth as a leading performance indicator.
Our interpretation: Financial Services companies in that size range understand that LinkedIn audience size is a genuine commercial asset in a relationship-driven industry. They are in audience-building mode, which is the right strategy before optimising for engagement rate. The follower growth figure is the leading indicator.
Benchmark table: Financial Services
MetricCompany sizeP90Engagement rate201-50016.5%Engagement rate501-1,00031.5%Engagement rate1,001-5,00021.4%Engagements per post501-1,000956Follower growth rate201-50018.2%
Oktopost’s take: The follower growth figure is what to watch here. Companies in the 201-500 band growing at 18-plus percent monthly are building something with compound value. When the engagement rate data matures and shows a similarly strong signal, this sector will be one of the most interesting stories in the B2B LinkedIn dataset.
Healthcare
The standout figure in the Healthcare data is not the engagement rate. It is follower growth.
Healthcare companies in the 51-200 employee band hit 21.5% monthly follower growth rate at P75. That is the highest growth figure in the April 2026 dataset across all sectors and all size bands.
Small healthcare companies are growing their LinkedIn audiences at a pace that most B2B marketers would consider exceptional. LinkedIn connects clinical and operational professionals with vendors and peers in a context that feels professional rather than promotional. Companies that publish content genuinely useful to that audience (not product-led content, but content that addresses what healthcare buyers are trying to solve, are being rewarded with follower growth that puts most other sectors to shame.
Benchmark table: Healthcare
MetricCompany sizeP75Engagement rate11-5013.5%Engagement rate51-2008.4%Engagement rate201-5009.9%Follower growth rate51-20021.5%
Oktopost’s take: The follower growth figure alone makes Healthcare worth watching closely in future installments. A sector where the P75 growth rate is 21.5% per month is a sector where LinkedIn is clearly working for the companies investing in it. Engagement rate benchmarks will sharpen with time. The growth signal is already telling you something important.
Legal Services
What the data suggests is that larger firms with active programmes are generating stronger engagement than the sector’s conservative reputation for digital marketing might imply.
The 5,001-10,000 employee band hit 10.5% engagement rate at P75, which sits above the cross-sector average for that size band. The 1,001-5,000 band hit 5.9% at P75 with 295 engagements per post. For a sector where content compliance concerns limit what firms can say and how quickly they can say it, those figures reflect real performance from firms that have worked out how to publish meaningfully within those constraints.
Benchmark table: Legal Services
MetricCompany sizeP75Engagement rate1,001-5,0005.9%Engagement rate5,001-10,00010.5%Engagements per post1,001-5,000295
Oktopost’s take: Legal Services demonstrates one of the widest performance gaps between firms with active LinkedIn programmes and firms that treat social primarily as a compliance exercise.
The variation between firms that invest in LinkedIn strategically and those that use it primarily as a compliance notice board is wider here than almost anywhere else in the dataset. As more law firms adopt Oktopost, this will become one of the most instructive sectors to watch because the gap between active and inactive programmes shows up starkly in the data.
Transportation
The sample size for this sector is small, and we are publishing these figures because transparency about what we have is more useful than silence, but treat them as indicators only.
The directional signal, with engagement rates in the 9-12% range at P75 for the bands covered, is consistent with the cross-sector pattern at those sizes. A meaningful Transportation benchmark will require more Oktopost platform pages in this sector.
Benchmark table: Transportation
MetricCompany sizeP75Engagement rate11-5012.2%Engagement rate201-5009.6%
Oktopost’s take: The companies doing LinkedIn well in Transportation are typically using supply chain intelligence and freight market data as their content format: original data that circulates widely in a professional community that tracks those signals closely. The benchmark will tell a more complete story as the dataset grows.
How do these LinkedIn benchmarks by industry compare to your company?
The single most actionable takeaway from the April 2026 data is this: benchmark within your size band, not across your sector. The difference between a 15.2% and a 37.9% engagement rate target is company size, not performance. Getting that wrong leads to false failure for mid-market companies chasing a small-company benchmark, and false confidence for small companies measuring themselves against an enterprise rate.
Technology, Legal Services, Financial Services, and Business Services give you the most reliable benchmarks this month, with cohorts large enough to anchor real targets. Manufacturing is the underdog story in the dataset, with consistently strong rates across bands that rarely feature in B2B LinkedIn benchmarking conversations. The directional sectors will sharpen with each installment as the platform dataset grows.
Most LinkedIn benchmarks tell you what the average company achieves.
The more useful question is what companies like yours achieve.
That’s why every benchmark in this report is segmented by both industry and company size.
Because a benchmark only matters if it’s the right benchmark.
For broader B2B social media performance data across all channels, see the Oktopost B2B Social Report. For LinkedIn format benchmarks, see our analysis of LinkedIn carousel and PDF best practices. For context on how LinkedIn’s algorithm distributes organic reach, see our analysis of how LinkedIn’s AI-driven feed affects B2B content performance.
See where you stand. The Oktopost B2B LinkedIn benchmarking tool pulls your LinkedIn page data and scores it against the benchmarks in this report, segmented by your sector and company size. It is free and returns your percentile in under a minute.
Methodology
All LinkedIn benchmarks by industry in this report are derived from anonymized performance data from LinkedIn company pages managed through the Oktopost platform and collected during April 2026. Data covers April 2026 (1 April-30 April). All metrics are calculated at the company-page level; personal profile and LinkedIn Ads data are excluded. Company size bands follow LinkedIn’s native segmentation. To qualify for inclusion, a page must have published at least 4 posts during the measurement period.
Sector classification follows LinkedIn’s industry taxonomy. Where LinkedIn’s taxonomy produces sectors that overlap with each other, we used the primary sector tag on the company page.
P50, P75, and P90 thresholds are calculated within each sector-size-band cohort independently. Where a cohort contains fewer than 50 companies, the P90 figure is marked as directional. Where a cohort has fewer than 10 companies, P75 is used as the above-average reference line.
Engagement rate is calculated as total engagements divided by impressions for each post, averaged across the measurement period. Engagements include reactions, comments, shares, and clicks. Follower growth rate is the net percentage change in page followers over the calendar month.
The purpose of these LinkedIn benchmarks by industry is to help B2B marketers compare performance against organizations that genuinely resemble their own.
Network: LinkedIn only.
The post LinkedIn benchmarks by industry: what April 2026 data shows across 7 B2B sectors appeared first on Oktopost.