
Software-as-a-service (SaaS) continues to revolutionize the software market and the way businesses approach their operations. From flexibility to cost savings, the SaaS software model has risen in popularity.
Organizations now use an average of 112 SaaS applications, up from 16 in 2017. SaaS has become the dominant software model, representing over 50% of the market.
In this article, we’ll cover up-to-date statistics on SaaS usage, SaaS market size, and VC funding of SaaS startups.
Click for a specific section:
SaaS Industry Statistics
SaaS Usage Trends
SaaS Startup Funding Statistics
SaaS Industry Statistics
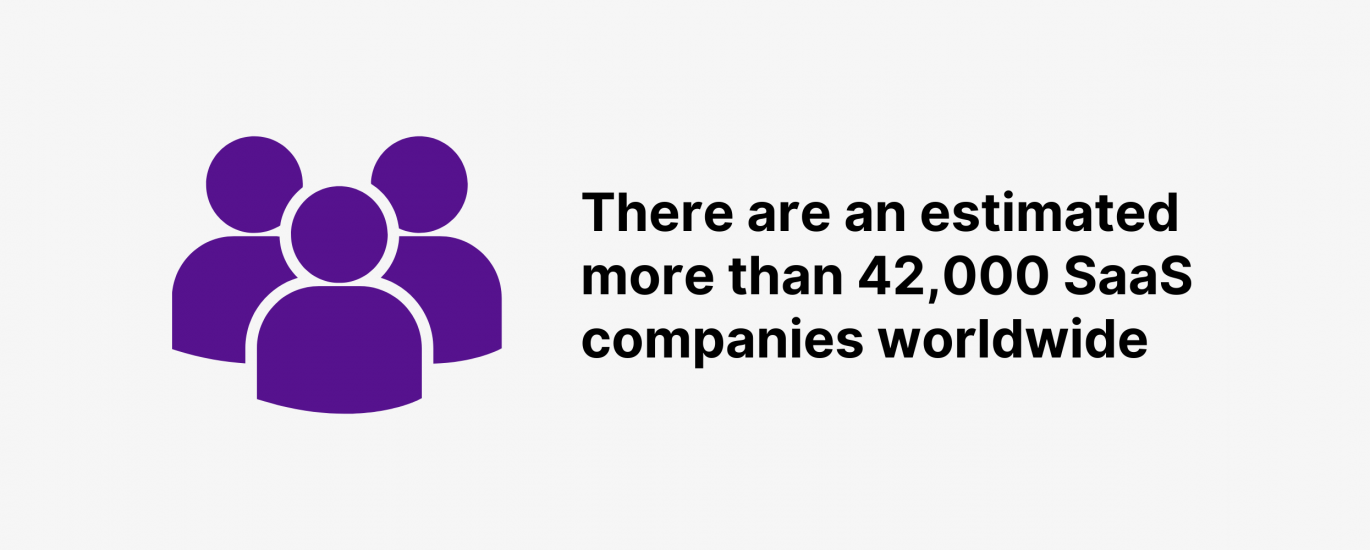
There are an estimated more than 42,000 SaaS companies worldwide (Latka)
The latest data shows that there are approximately over 42,000 SaaS companies worldwide.
A large share of these companies, totaling 12,400, are located in the United States. The remaining top countries by number of SaaS companies include the United Kingdom with 1,700 companies, Canada with 1,100, India with 1,100, and Germany with 916.
SaaS spending is estimated to reach $247.2 billion in 2024 (Gartner)
Global end-user spending on SaaS is estimated to hit $247.2 billion in 2024, showing a 20% year-over-year increase.
Worldwide SaaS spending is forecasted to grow to $295.08 billion in 2025.
Here’s a table with SaaS end-user spending worldwide since 2019:
Note: Includes forecasts
Year
SaaS Market Size
2023
$206 billion
2024
$247.2 billion
2025
$295.08 billion
86% of enterprise buyers indicated intentions to either raise or maintain their SaaS budgets (Sapphire Ventures)
According to a recent survey, 86% of enterprise buyers are planning to either boost or keep the same SaaS budgets. Specifically, 41% plan to increase their SaaS spending, while 45% expect to keep the SaaS budget at the same level as before.
SaaS accounts for the largest share of the overall cloud service market (Gartner, Gartner)
SaaS represents the largest share (36.6%) of the cloud service market overall and represents more than half of the entire software market.
SaaS Usage Trends
On average, companies use 112 SaaS apps (BetterCloud)
Organizations of various sizes use an average of 112 SaaS apps. That’s up from an average of 80 SaaS tools used in 2020.
Among companies with under 200 employees use an average of 42 SaaS applications. Large organizations with over 5,000 employees report the highest number of SaaS applications – 158 solutions.
Here’s a detailed breakdown of the number of SaaS apps used by company size:
Company Size
Average Saas Apps
1-199 employees
42
200-749 employees
103
750-1,499 employees
86
1,500-4,999 employees
142
5,000+ employees
158
On average, organizations spend between $1,000 and $3,500 each year per employee on SaaS applications (CloudEagle)
Recent analysis shows that companies tend to spend $1,000 – $3,500 per year on SaaS applications per employee.
71% of organizations say they’re “100% certain” or “extremely likely” to invest in AI-powered software (Gartner)
A recent poll shows that the vast majority (71%) of businesses are “very likely” or “certain” to invest in AI-powered software in 2024. The same survey shows that only 8% of respondents claim they’re not at all likely to invest in AI software.
SaaS Startup Funding Statistics
US SaaS and enterprise software startups received $17.4 billion in VC investments in 2023 (Crunchbase)
A total of $17.4 billion has been raised by US SaaS and enterprise software firms across 880 rounds in seed funding to growth-stage capital in 2023.
In 2024, VC funding in US SaaS companies reached $4.7 billion across 282 rounds as of May.
SaaS startups secured 47% of the venture capital funding in 2023 (Dealroom)
In 2023, startups with a SaaS business model captured 47% of VC funding. The SaaS category share grew from 36% in 2019 to 47% in 2023.
VC investments in SaaS startups worldwide reached $72.3 billion in H1 2024 (Dealroom)
In the first 6 months of 2024, the worldwide investment in SaaS startups by venture capitalists totaled $72.3 billion.
Here’s a detailed breakdown of VC investments in SaaS startups worldwide since 2020:
Year
VC Investment
2020
$118.7 billion
2021
$276.9 billion
2022
$209.3 billion
2023
$186.8 billion
2024
$72.3 billion
SaaS startups worldwide raised $10.3 billion in early-stage VC funding in H1 2024 (Dealroom)
In H1 2024, early-stage (rounds under $15 million) VC deal investment reached $10.3 billion, showing a 20.16% year-over-year decrease.
Here’s a table with early-stage VC investment data in SaaS startups globally by quarter:
Date
VC Investment
Q2 2019
$4.8 billion
Q3 2019
$4.7 billion
Q4 2019
$5.1 billion
Q1 2020
$5.5 billion
Q2 2020
$5.1 billion
Q3 2020
$5.5 billion
Q4 2020
$5.6 billion
Q1 2021
$7.2 billion
Q2 2021
$7.6 billion
Q3 2021
$7.6 billion
Q4 2021
$9 billion
Q1 2022
$9.6 billion
Q2 2022
$10.5 billion
Q3 2022
$9.8 billion
Q4 2022
$8.9 billion
Q1 2023
$6.5 billion
Q2 2023
$6.4 billion
Q3 2023
$5.2 billion
Q4 2023
$5.5 billion
Q1 2024
$5.3 billion
Q2 2024
$5 billion
Enterprise SaaS startups worldwide received $21.9 billion in VC funding in Q2 2024 (PitchBook)
In Q2 2024, VC deal value in enterprise SaaS companies reached $21.9 billion across 713 funding rounds.
The post 10+ Key SaaS Statistics to Know appeared first on Backlinko.